Climate XChange, a nonprofit organization with over 15,000 members, aims to drive a zero-emissions economy by advancing climate policy nationwide. Central to this mission is tracking climate policies across all 50 US states and presenting them in an online dashboard.
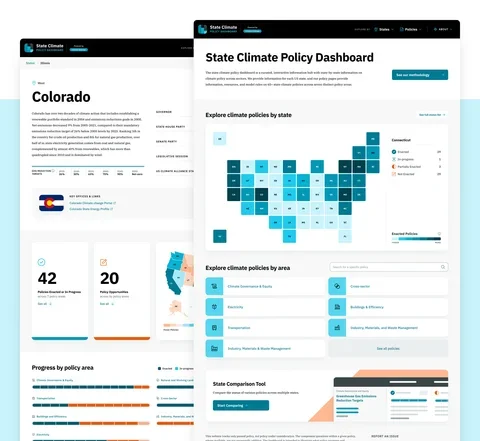
We built a new, user-friendly, interactive dashboard that lets policymakers, researchers, and the public easily compare and analyze policies at the state level. Now, updates are a breeze, thanks to simple spreadsheet uploads.
Establishing clear goals
We quickly researched the state policy space, the existing dashboard, and its users and maintenance processes. Through interviews, surveys, and workshops with stakeholders, we set clear goals to:
- Establish a user-friendly structure for state policy information, allowing Climate XChange to showcase how to advance policies when opportunities exist.
- Identify the ideal technologies for powering the dashboard.
- Position Climate XChange to get buy-in from data partners and secure funding for future development.
Improving the interface
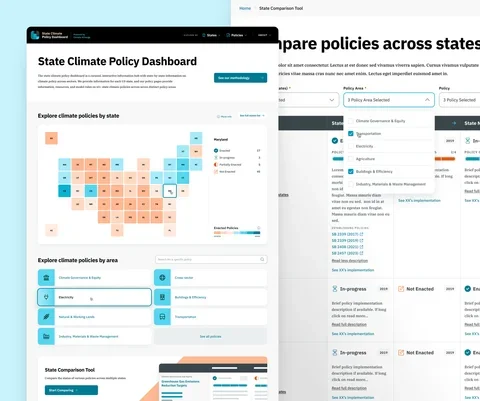
We redesigned the content structure and built clickable prototypes for key pages and templates, enabling users to find information faster. These designs gave Climate XChange an invaluable tool for presenting the new dashboard to potential partners and funders.
Complex data management and visualization
The dashboard needed to manage and visualize data from a large partner network. We streamlined updates by setting up an easy CSV upload workflow, saving time and costs and paving the way for integrating future partners.
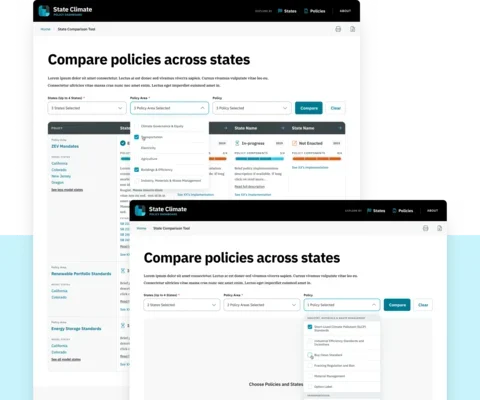
Data is stored in Drupal, while JavaScript powers visualizations and interactivity. Users can now compare up to three states side-by-side, offering a clear view of policy implementations.
Responsive design and accessibility
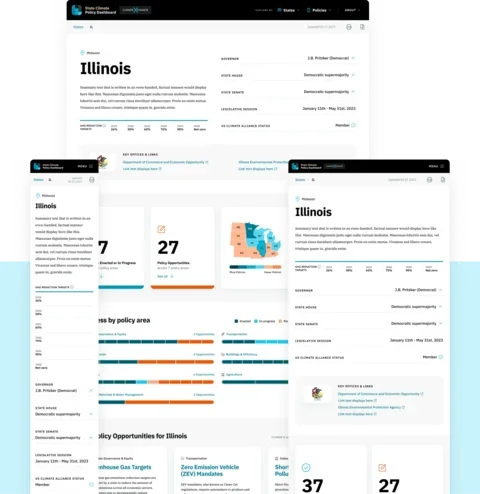
The dashboard is functional and accessible across devices and for users with disabilities, ensuring a consistent design and user experience. We used semantic HTML for screen readers, strong color contrast, keyboard navigation, ARIA attributes for interactive elements, responsive tables for data-heavy areas, and easy-to-read fonts.
A valuable resource for policymakers, researchers, and climate advocates
Users can now easily track and compare state policies, supporting better-informed decisions. The interactive features and data visualizations have received positive feedback for their user-friendliness and clarity.
The new dashboard also saves Climate XChange staff significant time—what once took days or even a week can now be done in minutes with a quick spreadsheet upload.
Lullabot has exceeded our expectations in bringing this user-friendly and data-rich platform to life, and it is already making a significant impact on the climate policy landscape.
Project credits
The following people contributed to the success of this project.
-
Megh Plunkett
Senior Content Strategist
-
Jared Ponchot
CCO
-
Farrah Yoo
UI Designer
-
Jerad Bitner
Senior Technical Project Manager
-
Nate Lampton
Senior Technical Architect
-
Aubrey Sambor
Lead Engineer
-
Hunter MacDermut
Senior JavaScript Developer
Services
We provided the following kinds of services to help this project succeed.
-
Digital & Content Strategy
-
Drupal Development
-
Front-end Development
-
Technical Architecture
-
Technical Project Management
-
UI Design
-
User & Market Research
-
UX & Design


